With the Atlassian Team '25 event making waves in the ecosystem—most notably the announcement that Rovo will be free with all Jira plans—there’s a lot of buzz. But while those updates settle in, let’s shift focus to a critical topic: reporting in Jira.
Teams rely heavily on Jira data to make informed decisions. Whether you’re tracking sprint progress, monitoring service requests, or sharing KPIs with stakeholders, reporting becomes the bridge between operations and strategy. In this post, we'll explore various reporting strategies:
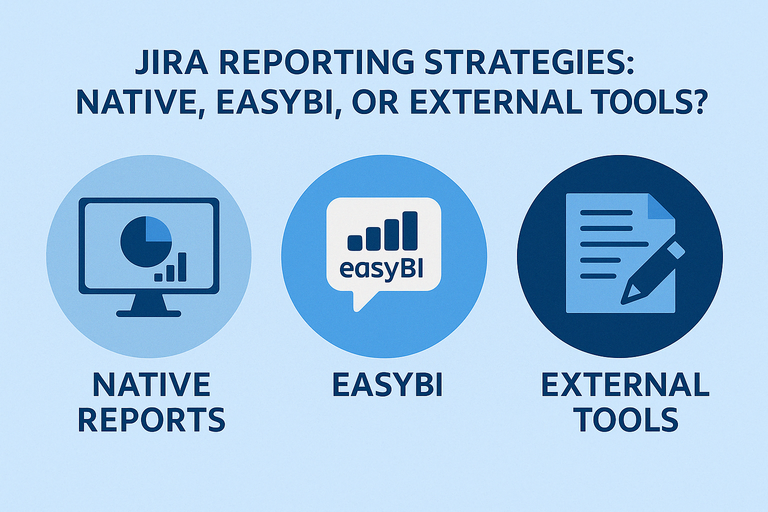
- Jira’s native reports
- EasyBI for advanced in-app analytics
- External tools like Power BI, Tableau, or Excel
1. Jira Native Reports – Best for Day-to-Day Users
Jira's built-in reports are perfect for:
- Developers
- Marketing teams
- Service desk agents
- Project managers needing real-time dashboards
These native reports are fast, real-time, and great for quick insights:
- Pie charts
- Burndown charts
- Velocity charts
If your goal is to track open vs. closed issues, sprint health, or backlog status, native Jira reports will suffice for most day-to-day operations.
2. EasyBI – Powerful, But with a Learning Curve
EasyBI is a paid app that sits within Jira. It allows you to:
- Create custom charts, tables, and KPIs
- Schedule report exports
- Embed dashboards into Confluence or Jira
However, EasyBI is not real-time. It works on scheduled imports (e.g., every hour or daily), which means data may lag a bit. It's also not the easiest to configure:
- Requires knowledge of MDX (its query language)
- Offers JSON exports but limited flexibility in visual formatting
- Email reports are fixed in design and less customizable
Still, for medium-to-large teams, EasyBI offers a great balance between native Jira limitations and external BI tool complexity.
3. External BI Tools – Full Control & Beautiful Dashboards
If your team has higher reporting expectations, external tools like:
- Power BI
- Tableau
- Excel (with macros or VBA)
can be used to extract Jira data (usually via REST API) and build:
- Custom reports
- Interactive dashboards
- Executive summaries for SharePoint, PowerPoint, or display monitors
This option is ideal if you have:
- A dedicated BI or data analysis team
- Highly specific formatting or sharing requirements
- A need to integrate Jira data with other systems
Some use cases include:
- Weekly executive dashboards
- Project health summaries
- Cross-project or cross-tool reporting
Making the Right Choice
Each reporting method has its strengths:
- Native Jira Reports: Best for daily users and immediate feedback
- EasyBI: For teams needing internal, repeatable reporting without real-time dependency
- External Tools: Ideal for strategic insights, big-picture metrics, and stakeholder presentations
In reality, many organizations benefit from a mix of all three.
Pro Tip for Jira Admins
If you’re a Jira admin or consultant, get comfortable with the Jira REST API:
- Learn to pull data with curl or Postman
- Explore authentication flows
- Know the common endpoints
Being fluent with the API allows you to assist users who want to build integrations, automate data pulls, or connect Jira with external BI tools.
Final Thoughts
Jira reporting doesn’t have to be one-size-fits-all. Evaluate your needs, tools, and team skills—and build a strategy that grows with your organization.
Have questions about reporting setups? Drop a comment or reach out—we’re here to help!